
The Department of Education has debuted a new online budget tool that breaks down exactly how much money New York City public schools receive and spend. This is the first time that such detailed reports have been shared so transparently with the general public, with all budget information for each student laid out on a single page.
Here is our overview of budget allocations per student, students in poverty, English Language Learners and students with IEP’s for public elementary schools in Brooklyn Heights, DUMBO, Downtown Brooklyn, BoCoCa, Clinton Hill, Fort Greene, Park Slope, Prospect Heights, Gowanus, Bed Stuy, and Red Hook.
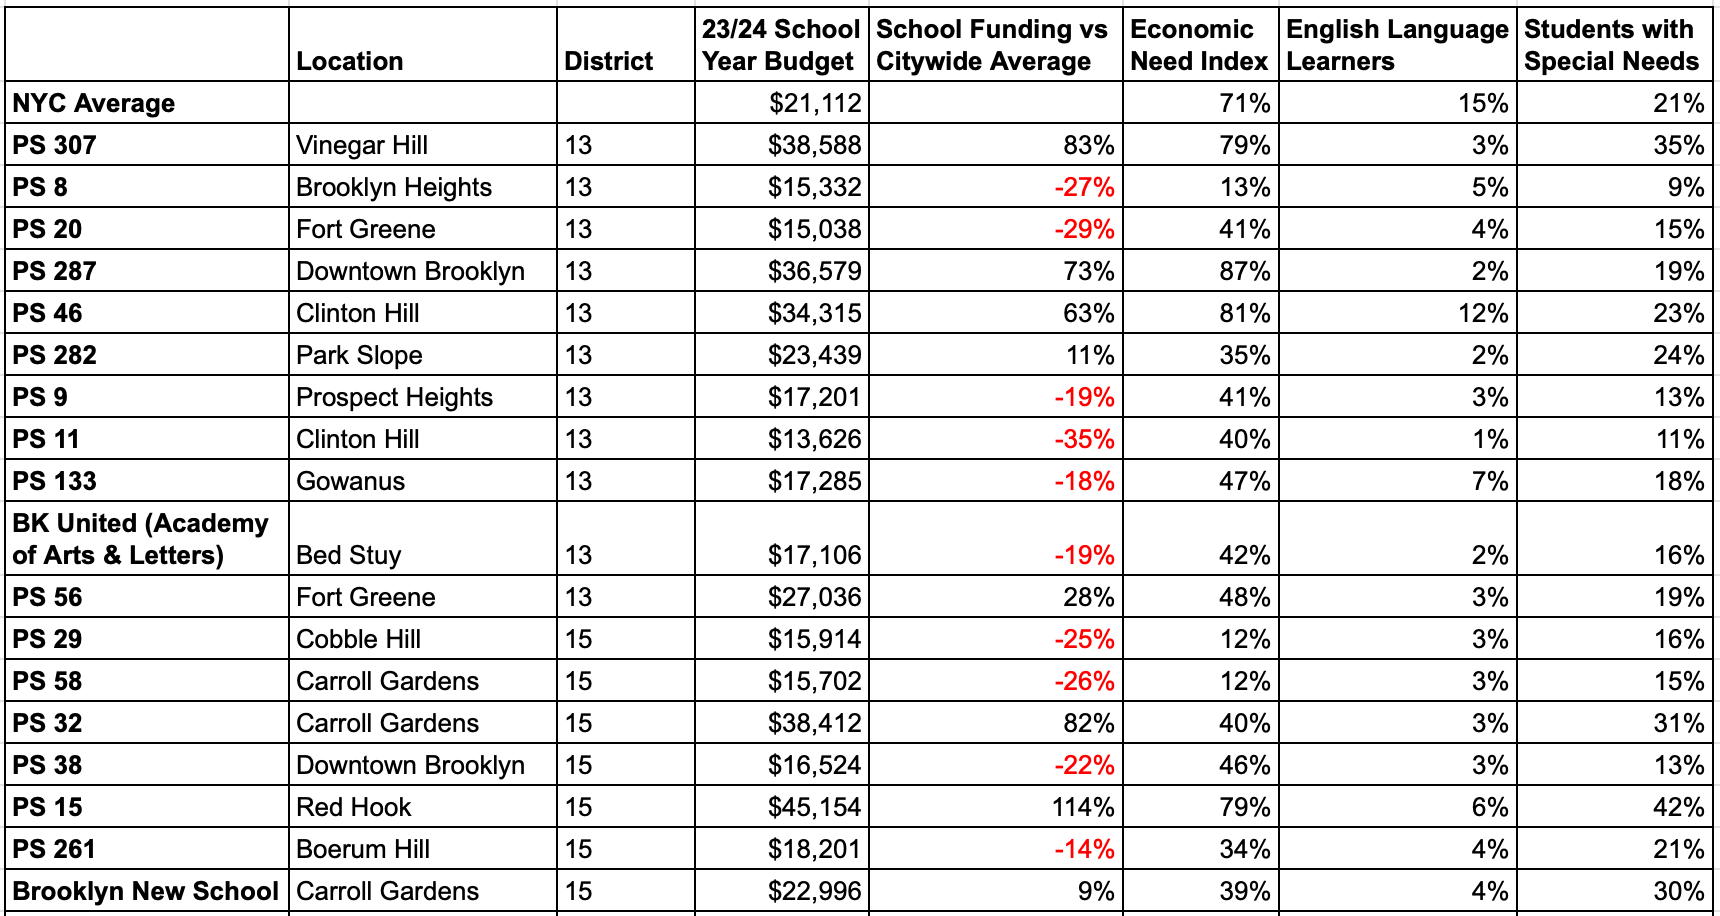
Schools in Districts 13 & 15 with the largest budgets in 2023-2024 included:
- PS 15 in Red Hook: $45,154, +114% above citywide average
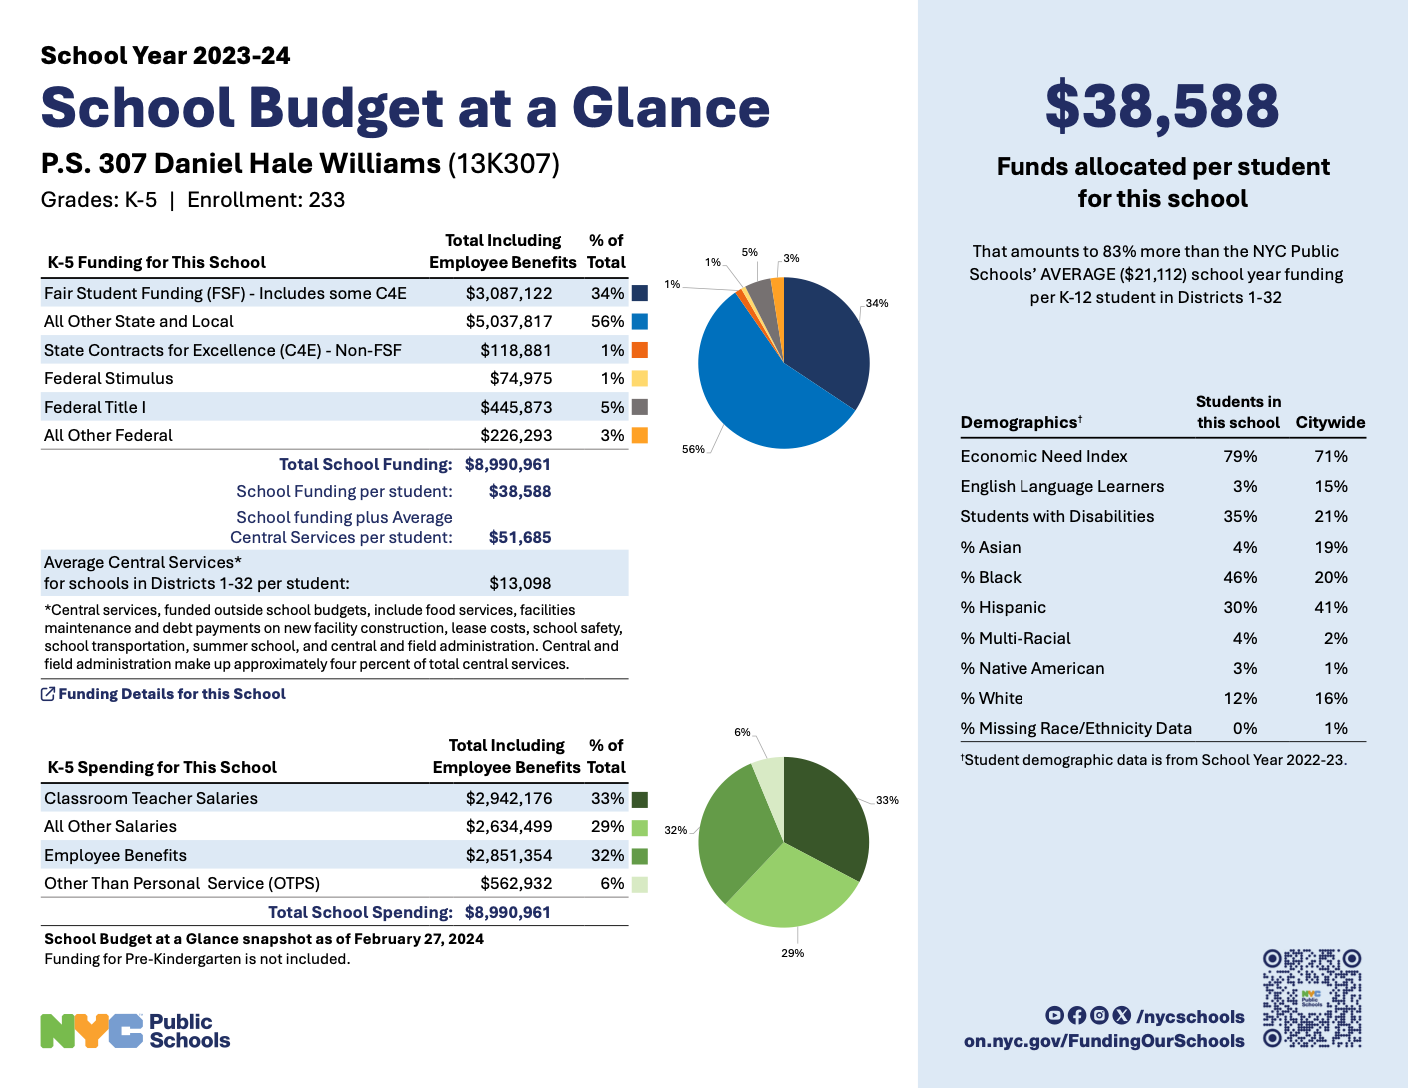
- PS 307 in Vinegar Hill: $38,588, +83% above citywide average
- PS 32 in Carroll Gardens: $38,412, +82% above citywide average
Schools in Districts 13 & 15 with the smallest budgets in 2023-2024 included:
- PS 11 in Clinton Hill: $13,626, -35% below citywide average
- PS 20 in Fort Greene: $15,038, -29% below citywide average
- PS 8 in Brooklyn Heights: $15,332, -27% below citywide average
These detailed budgets can be found on the DOE website. You can search to find a school, then on each school’s page, click on the “Reports” tab, then “Budget and Finances,” then “Budget At A Glance.”
The Budget At A Glance pages share each school’s overall budget and how much money is allocated per student, compared to the NYC public school average of $21,112 per student. This figure does not include expenses such as school food, transportation, safety agents, and facilities maintenance. With these additional costs, averaging around $13,000 per student, the total spending per student comes to about $34,000.
The reports also detail how much money is received from city, state, and federal sources. One source of funding, called Fair Student Funding, directs more money to higher-need schools and is calculated through an algorithm developed by the DOE. Budgets also show Title I funding and other funding initiatives for high-poverty schools.
Demographics for each school are included, such as an Economic Need Index estimating the percentage of students facing economic hardship. Budgets also show the percentage of students who are English Language Learners, and the percentages of students with special needs.
Finally, spending is broken down by classroom teacher salaries, all other salaries, employee benefits, and other expenses.
Updated: June 24, 2024.