


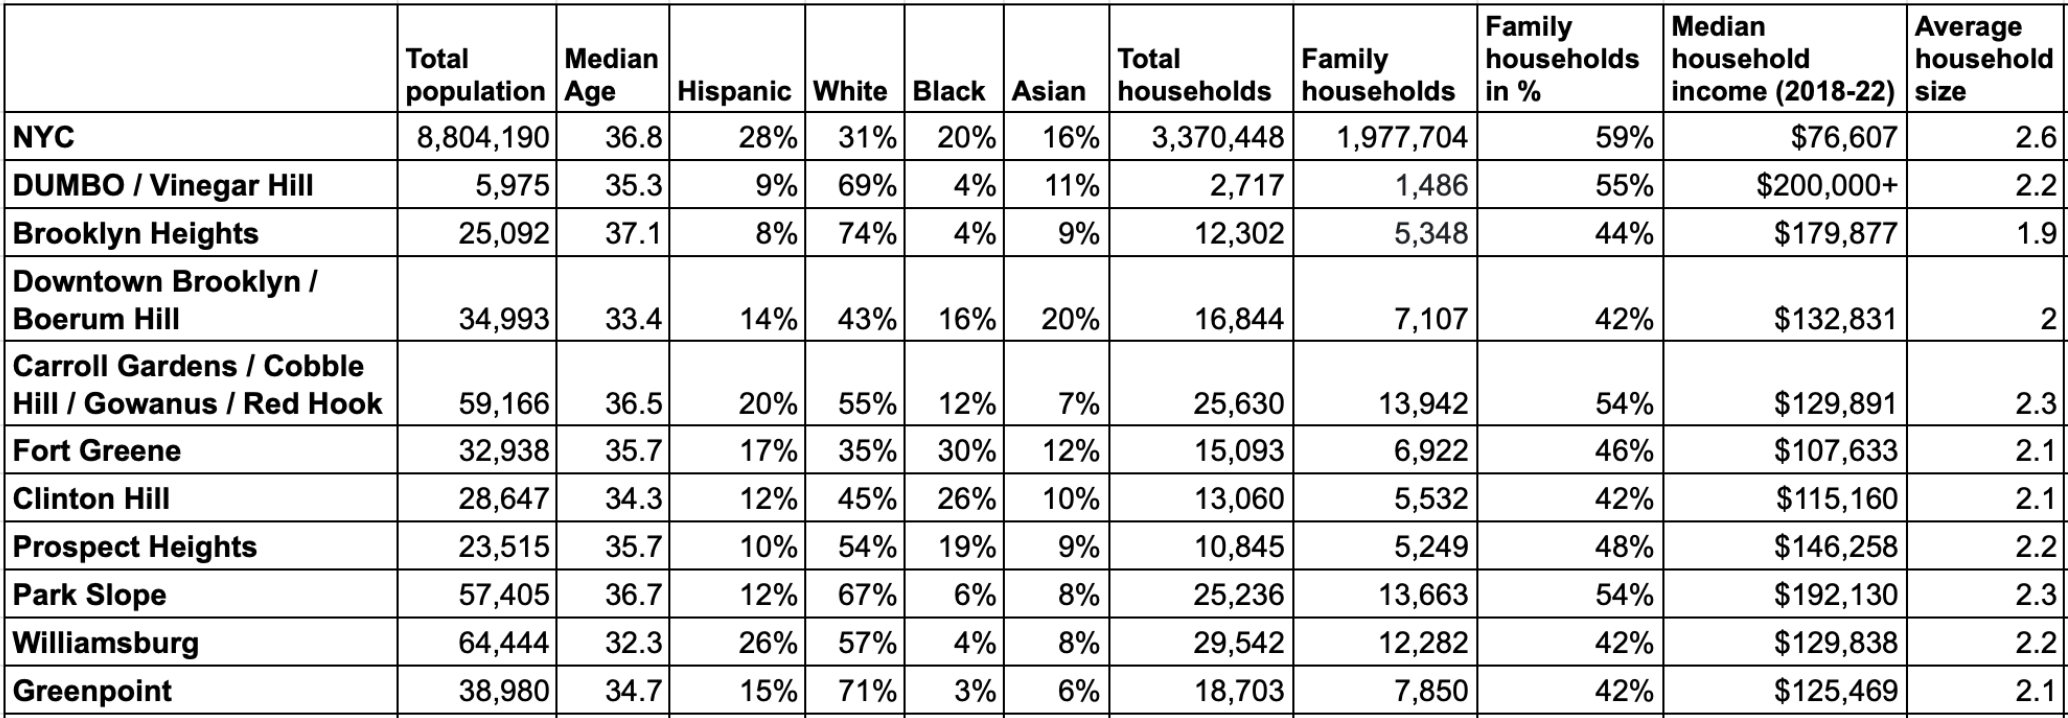
DUMBO and Vinegar Hill have the highest household incomes and highest percentage of family households, Williamsburg’s population has the youngest average age, and Brooklyn Heights has the oldest. All of this data about our neighborhoods is now up to date and and free to access with an interactive online tool created by the Department of City Planning. Here is our overview of 2020 census data in our Brooklyn neighborhoods, including statistics on total population, age, race, family households, average household income, and median rent and sales prices.
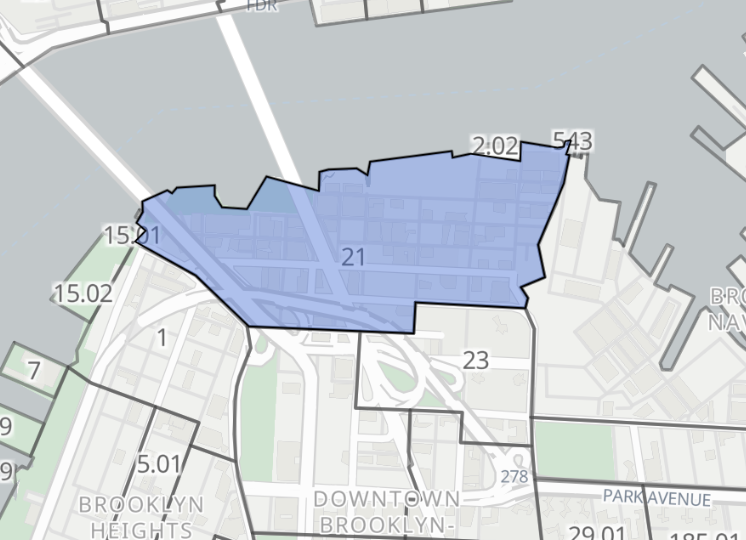
The NYC Population FactFinder now includes 2020 Census statistics, offering a detailed picture of current demographics in New York City. The FactFinder allows you to select any area to study, whether a smaller neighborhood or larger district, and dive into population data about your selected area.
Median household incomes by neighborhood ranked
Most families in % of households per neighborhood ranked
DUMBO & Vinegar Hill
- Total population: 5,975
- Median age: 35.3
- Race demographics: Hispanic 9%, White 69%, Black 4%, Asian 11%
- Total households: 2,717
- DUMBO & Vinegar Hill has the highest percentage of family households, at 55% (1,486 family households).
- DUMBO & Vinegar Hill has the highest median household income in our neighborhoods, at $200,000+ for 2018-2022.
- Average household size: 2.2
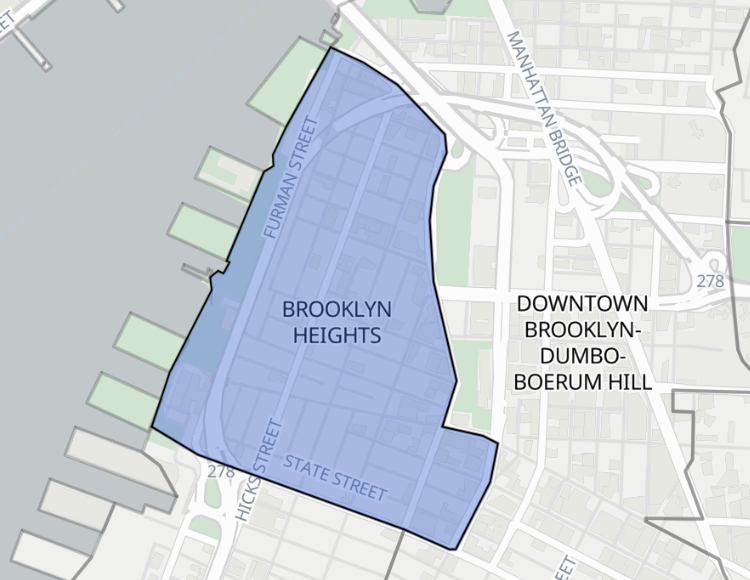
Brooklyn Heights
- Total population: 25,092
- Brooklyn Heights has the oldest median age at 37.1.
- Race demographics: Hispanic 8%, White 74%, Black 4%, Asian 9%
- Total households: 12,302
- Family households: 5,348 (44% of households)
- Median household income: $179,877
- Brooklyn Heights has the smallest average household size, at 1.9.
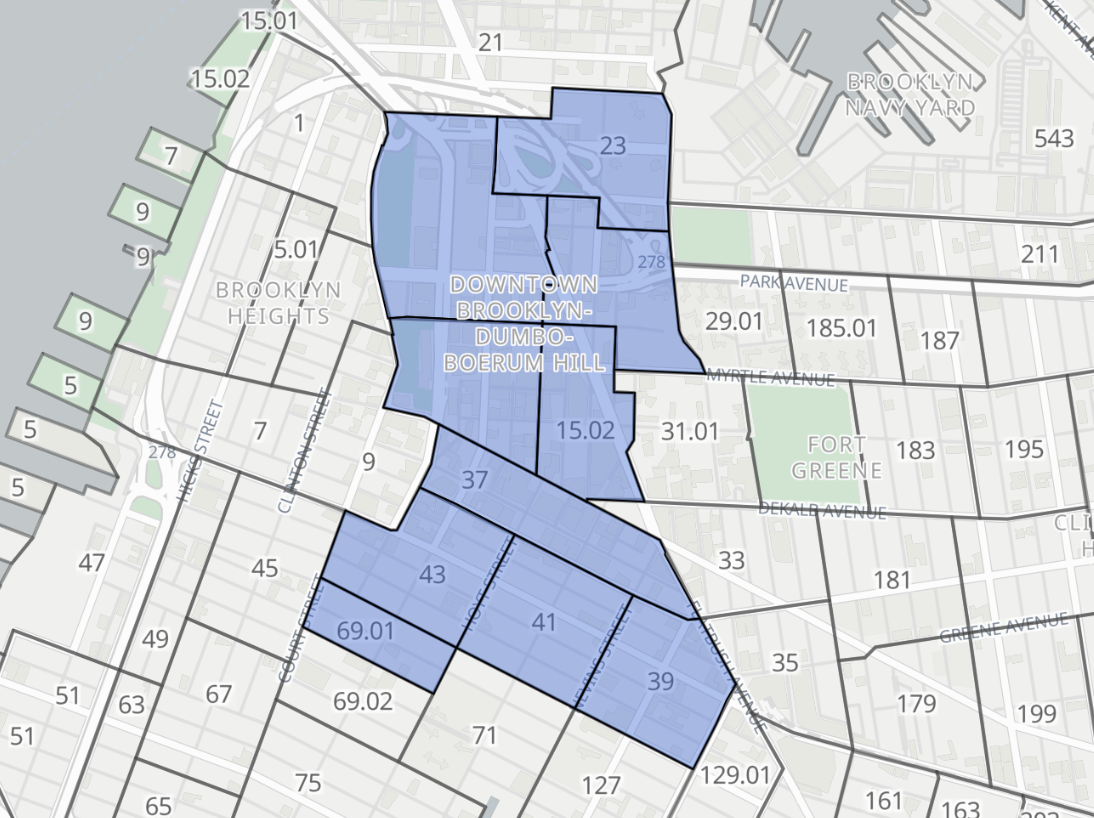
Downtown Brooklyn & Boerum Hill
- Total population: 34,993
- Median age: 33.4
- Race demographics: 14% Hispanic, 43% White, 16% Black, 20% Asian.
- Total households: 16,844
- Family households: 7,107 (42% of households)
- Median household income: $132,831
- Average household size: 2.0
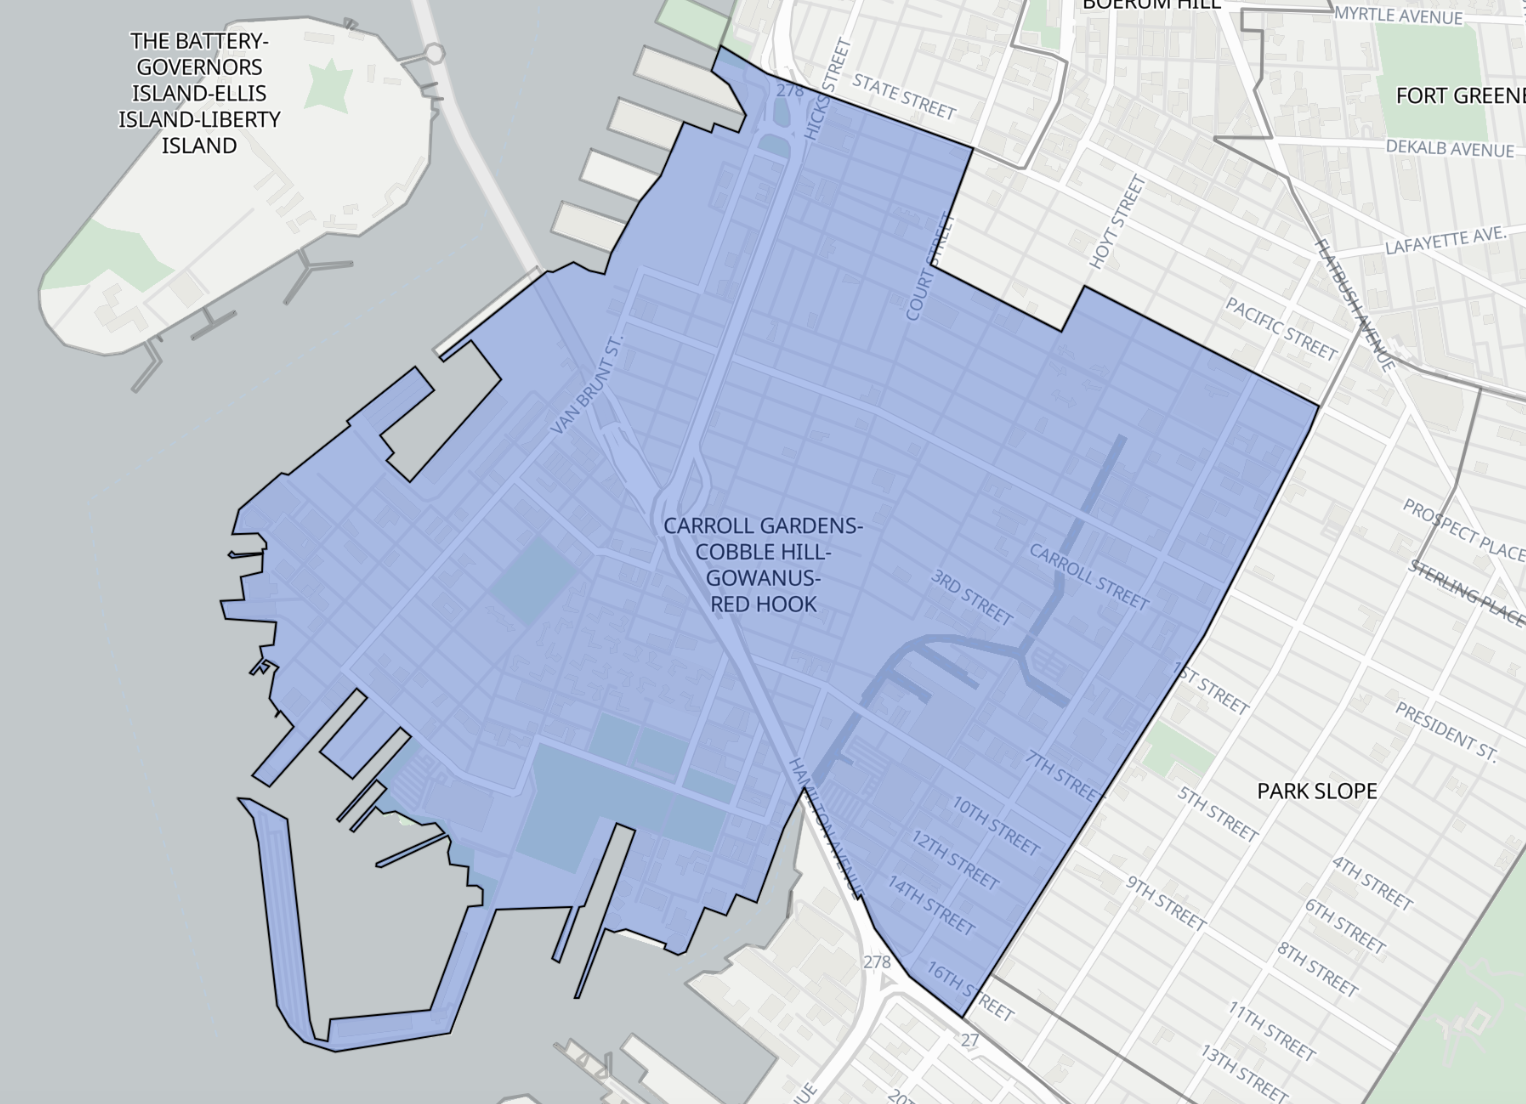
Carroll Gardens, Cobble Hill, Gowanus & Red Hook
- Total population: 59,166
- Median age: 36.5
- Race demographics: 20% Hispanic, 55% White, 12% Black, 7% Asian
- Total households: 25,630
- Family households: 13,942 (54% of households)
- Median household income: $129,891
- This area has the largest average household size, at 2.27.
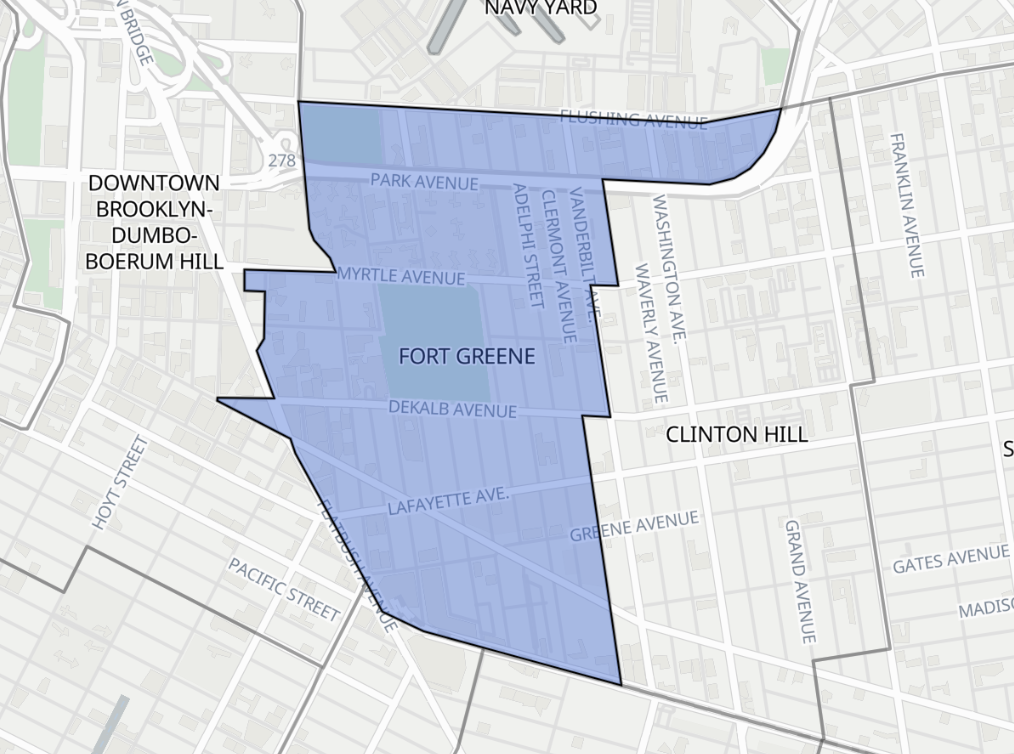
Fort Greene
- Total population: 32,938
- Median age: 35.7
- Race demographics: 17% Hispanic, 35% White, 30% Black, 12% Asian. This area is more racially diverse than other neighborhoods.
- Total households: 15,093
- Family households: 6,922 (46% of households)
- Median household income: $107,633
- Average household size: 2.1
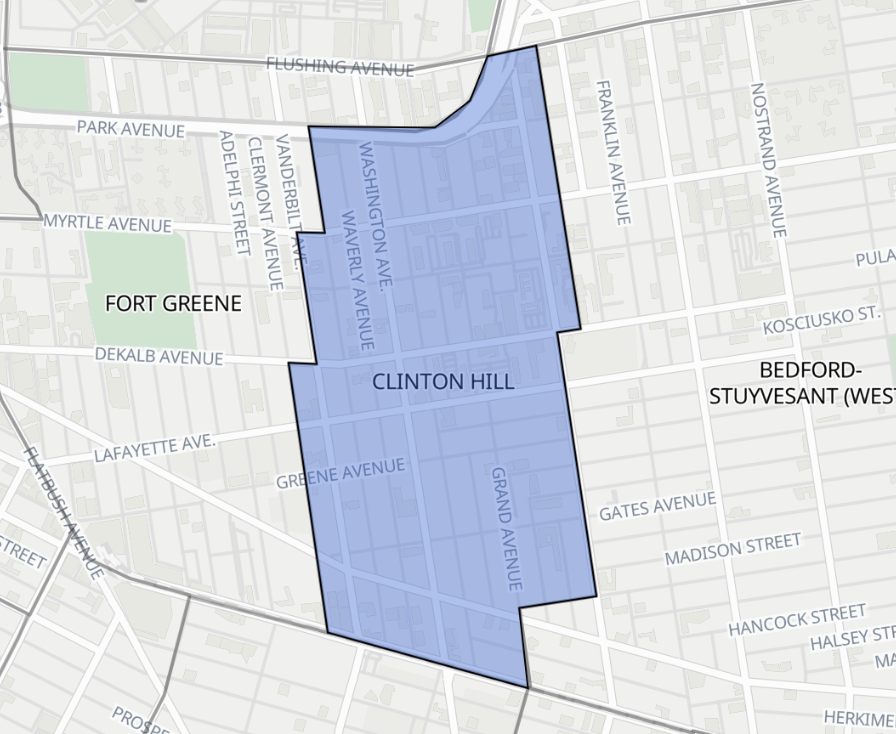
Clinton Hill
- Total population: 28,647
- Median age: 34.3
- Race demographics: 12% Hispanic, 45% White, 26% Black, 10% Asian
- Total households: 13,060
- Family households: 5,532 (42% of households)
- Median household income: $115,160
- Average household size: 2.1
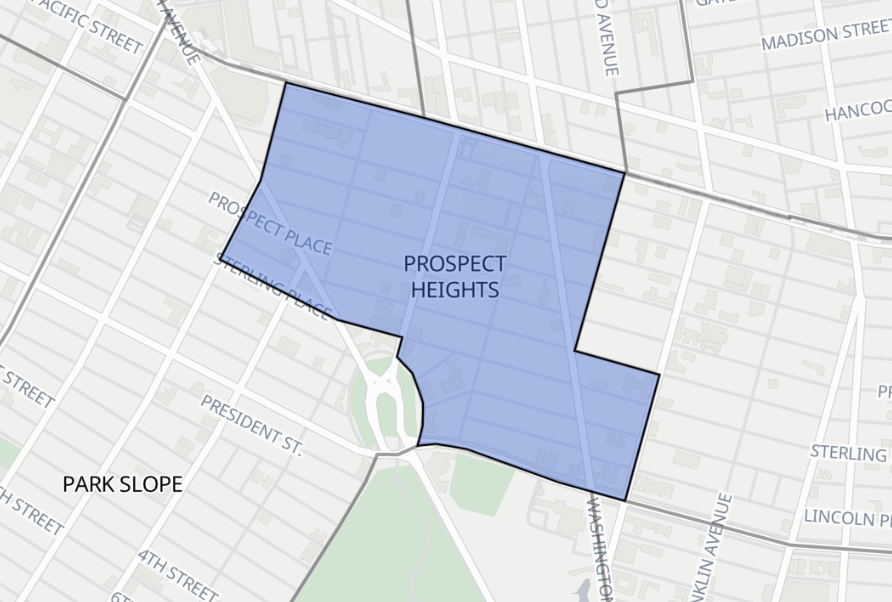
Prospect Heights
- Total population: 23,515
- Median age: 35.7
- Race demographics: 10% Hispanic, 54% White, 19% Black, 9% Asian
- Total households: 10,845
- Family households: 5,249 (48% of households)
- Median household income: $146,258
- Average household size: 2.2
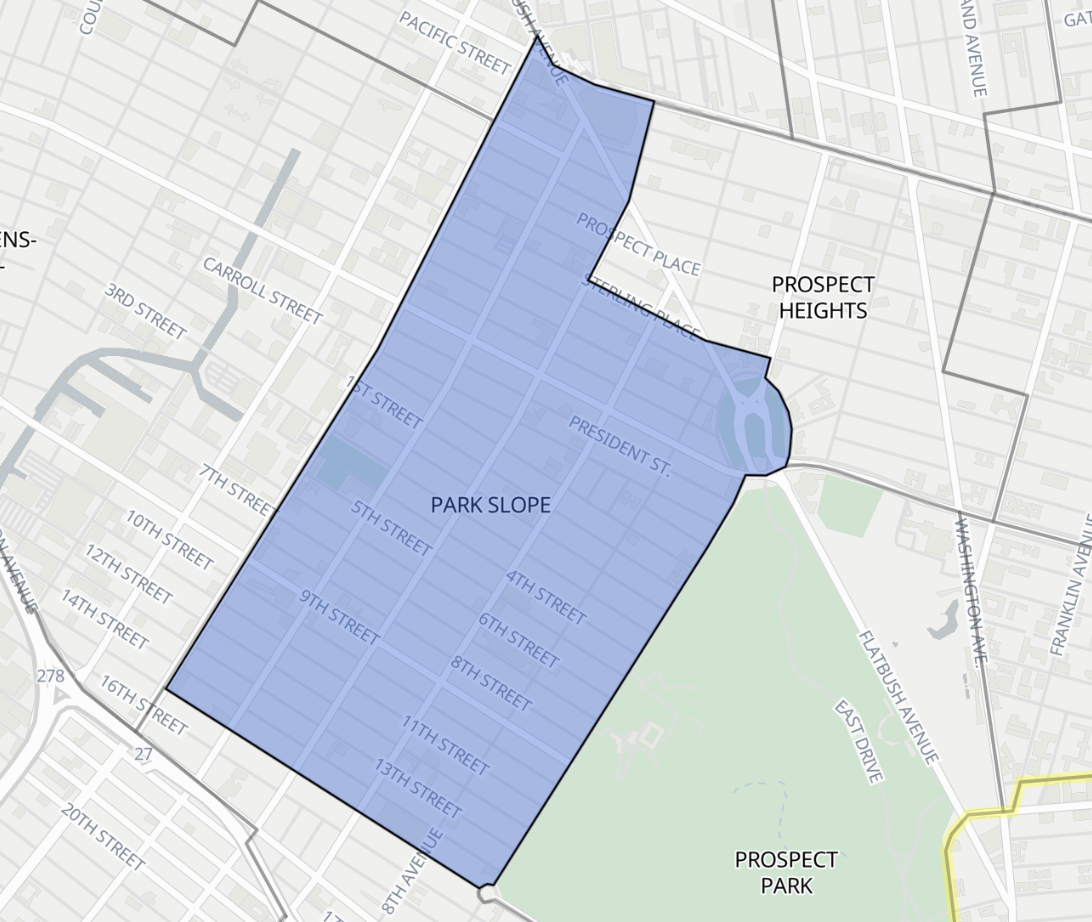
Park Slope
- Total population: 57,405
- Median age: 36.7
- Race demographics: 12% Hispanic, 67% White, 6% Black, 8% Asian
- Total households: 25,236
- Family households: 13,663 (54% of households)
- Median household income: $192,130
- Average household size: 2.3
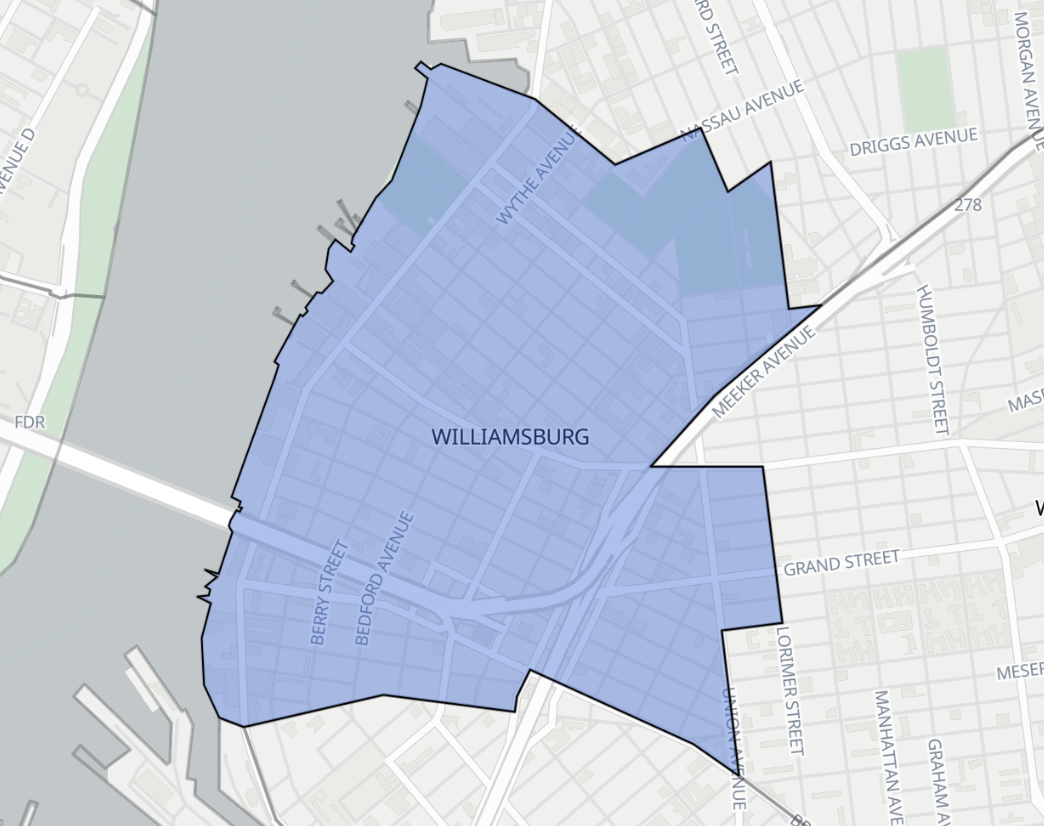
Williamsburg
- Total population: 64,444
- Williamsburg has the youngest median age, 32.3.
- Race demographics: 26% Hispanic, 57% White, 4% Black, 8% Asian
- Total households: 29,542
- Family households: 12,282 (42% of households)
- Median household income: $129,838
- Average household size: 2.2
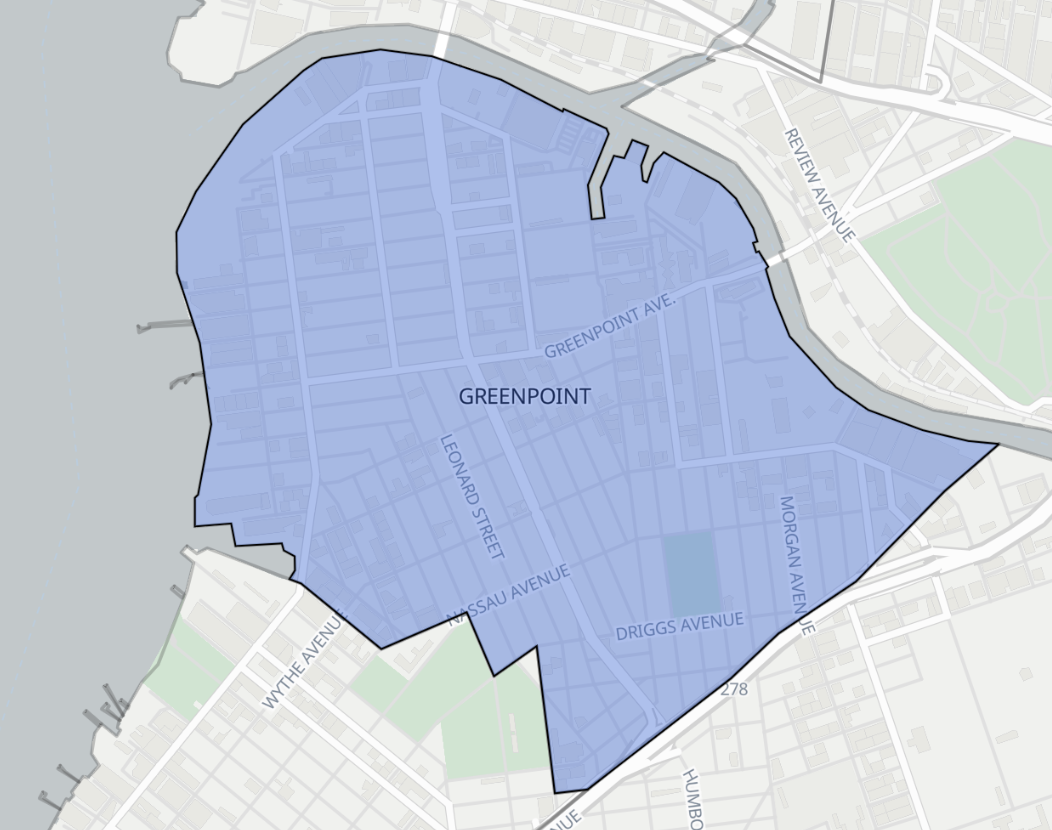
Greenpoint
- Total population: 38,980
- Median age: 34.7
- Race demographics: 15% Hispanic, 71% White, 3% Black, 6% Asian.
- Total households: 18,703
- Family households: 7,850 (42% of households)
- Median household income: $125,469
- Average household size: 2.1
The FactFinder also allows you to compare and contrast data for selected areas against overall New York City statistics, boroughs, or other neighborhoods or districts. The tool can also show you how a selected area has changed over time. Finally, users can also add map layers to see things like the subway system, population density, or the locations of schools.
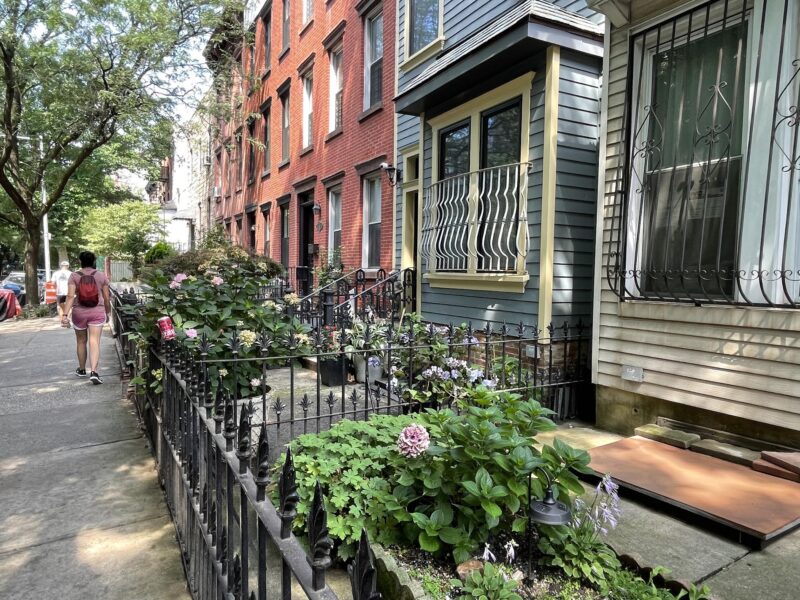
Updated: July 9, 2024. Main Image: A neighborhood street in Greenpoint, Brooklyn.